Solar Generator Cost Savings and Break even analysis
|
Solar Power Generator Costs Vs Standard generators and Standard Power bills |
|||||||||||||||
|
Initial / Unit cost |
Power Source |
Gallons |
Hours |
Load |
Gallons per hour |
Cost per hour based on $3.00 fuel price |
Cost per day |
Fuel / Grid cost per month |
Monthly fuel cost gallons |
Annual hours |
Annual Cost |
Annual cost over 10 years |
Annual Cost of ongoing electricity |
||
|
$1,200.00 |
12000 |
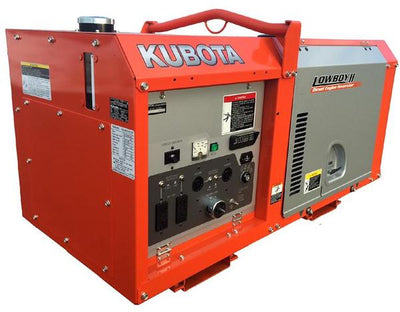
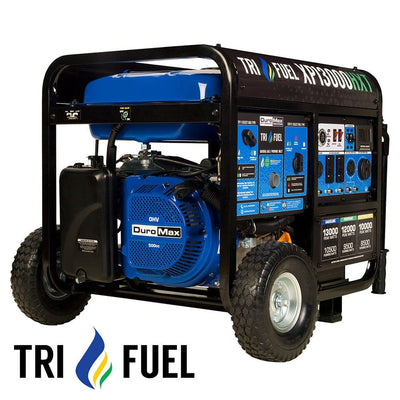
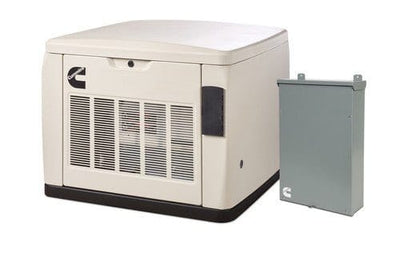
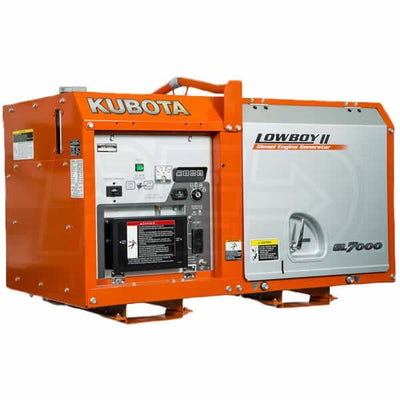
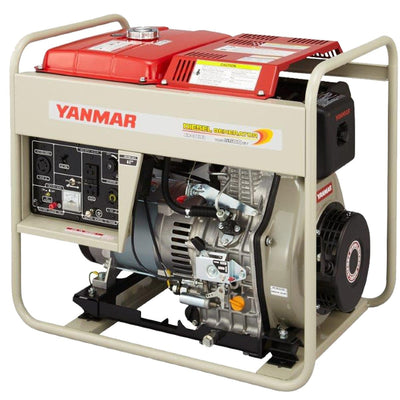
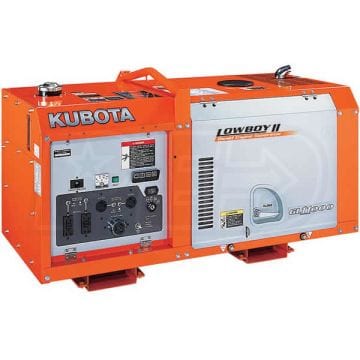
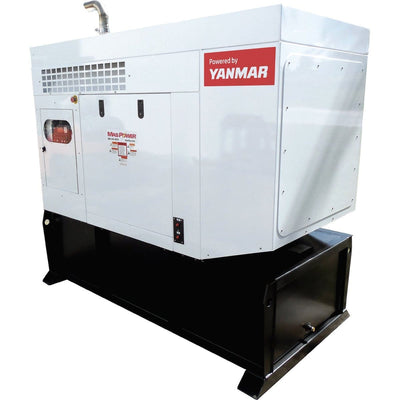
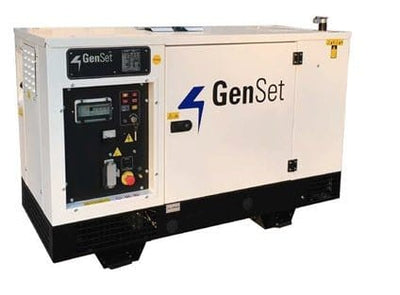
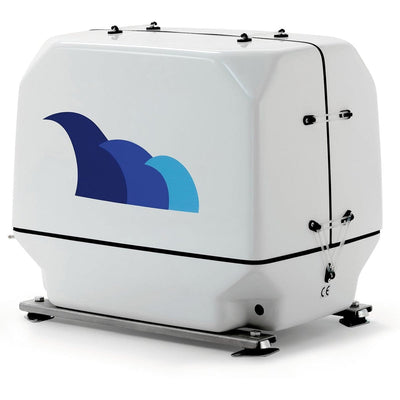
Watt Gas Generator |
8.3 |
8 |
50% |
1.0375 |
$3.11 |
$74.70 |
$2,241.00 |
$747.00 |
8760 |
$27,265.50 |
$27,265.50 |
$27,265.50 |
|
|
$123,000.00 |
12000 |
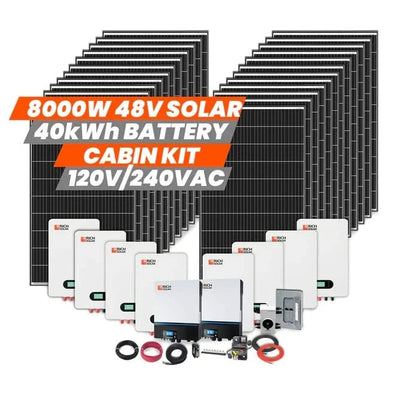
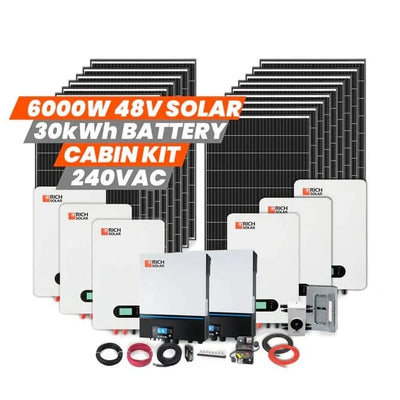
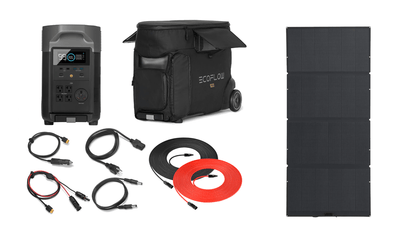
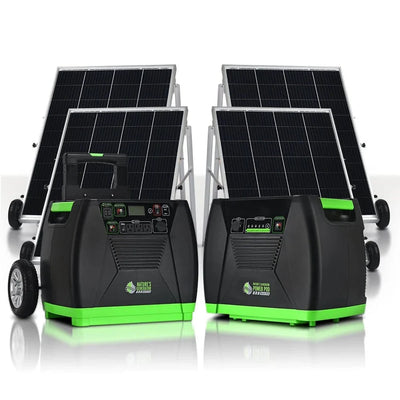
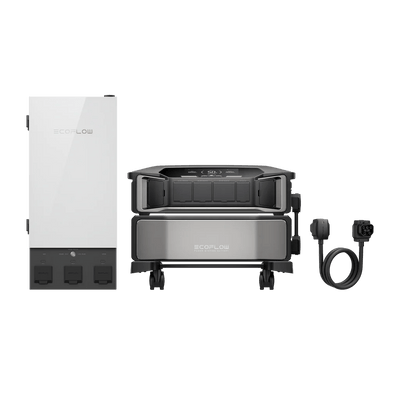
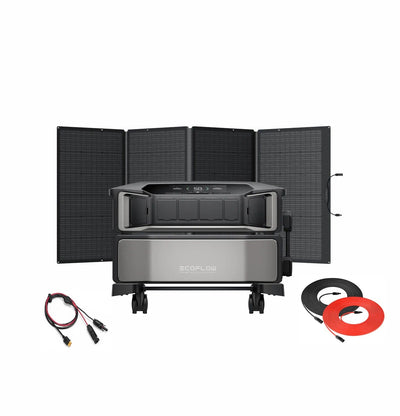
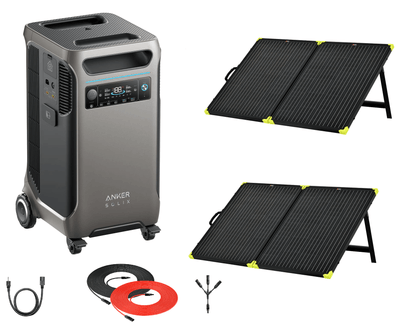
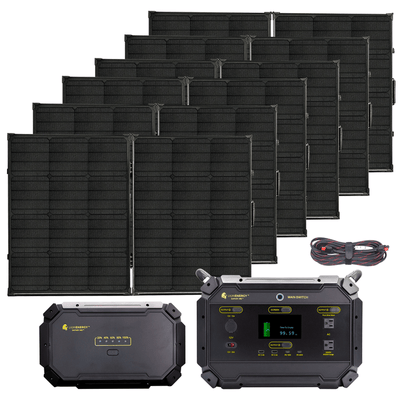
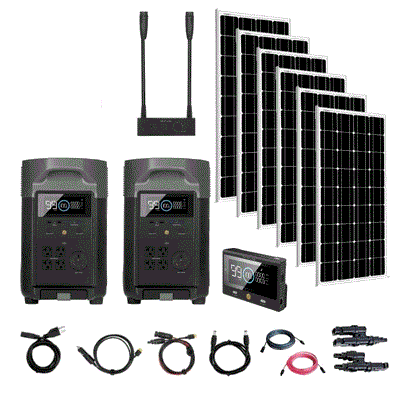
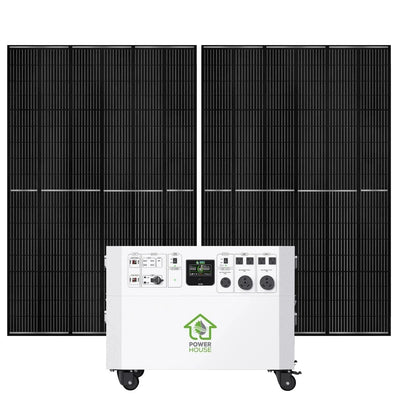
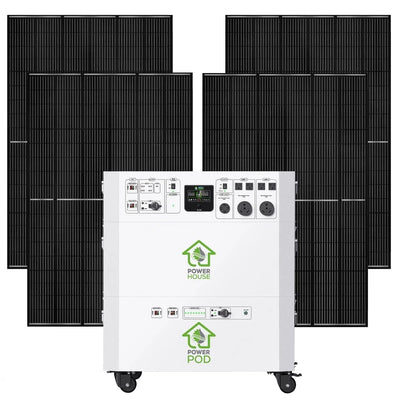
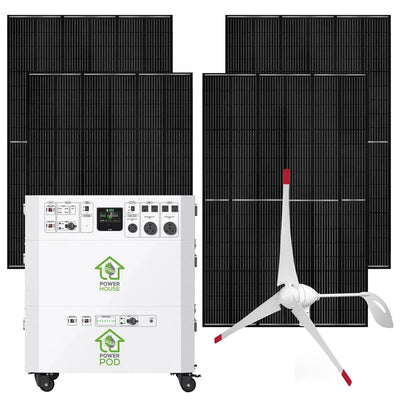
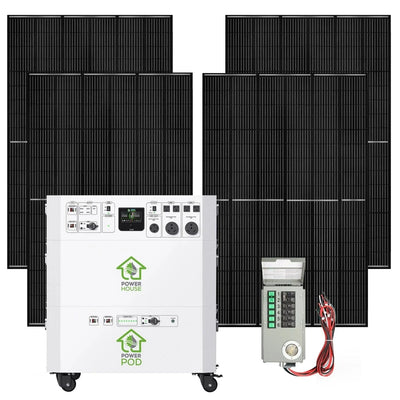
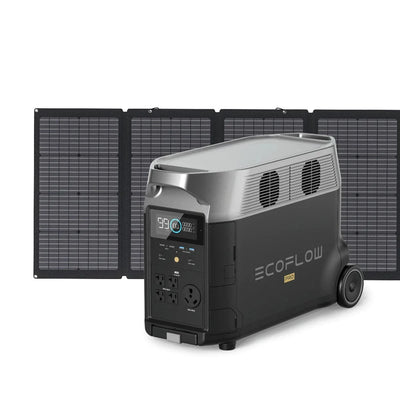
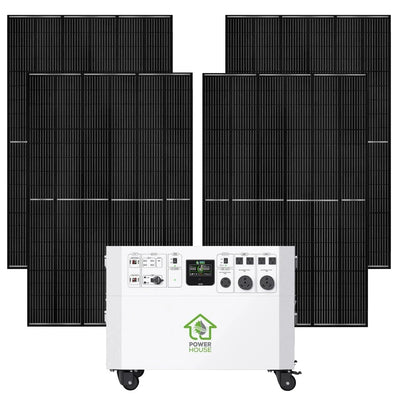
Watt Solar Generator |
$0.00 |
|
$12,300.00 |
$0.00 |
|||||||||
|
$0.00 |
Standard Grid at .32 per KWH -Bahamas |
|
|
|
|
|
$1,088.00 |
$ - |
|
$13,056.00 |
$13,056.00 |
$13,056.00 |
|||
|
When do you break even vs using a standard generator or paying a power bill? |
|||||||||||||||
|
Vs 1200 watt gas generator = 4.5 years, After 4.5 years of using the portable solar unit you save an estimated $27,000 per year vs using a gas generator. |
|||||||||||||||
|
Vs current 2019 Caribbean /or Hawaii standard electricity rates ($0.33/KWH) 9.41 years. After using the portable generate for 9.41 years it would have paid for itself in savings and save and estimated $13,000 per year vs paying an electric bill. |
|||||||||||||||
|
Based on the assumptions above, with the continued use of your Solar Generator for your power needs, your savings would would be from $1000 to $2400 per month after the break-even date. These solar units are extreme valuable with continued use. Theoretically, they will evenually make money by providing free power that never goes out with no gas or power bill ever. |
|||||||||||||||
|
* Standard solar pannels that are fixed to your home cost more than these portable units. |
|||||||||||||||


